
Update: 2021-01-22
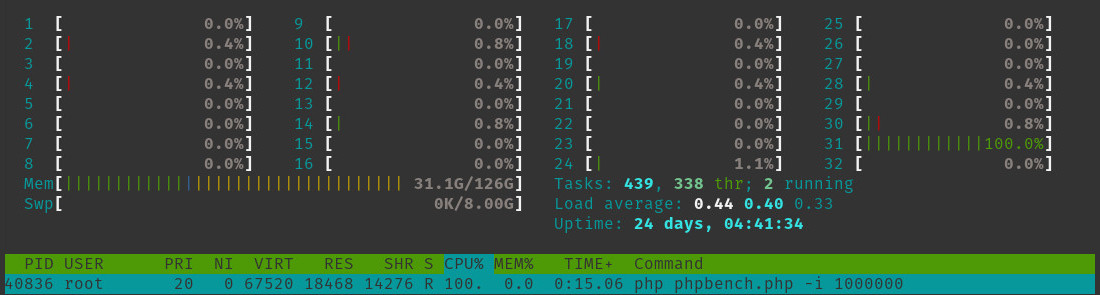
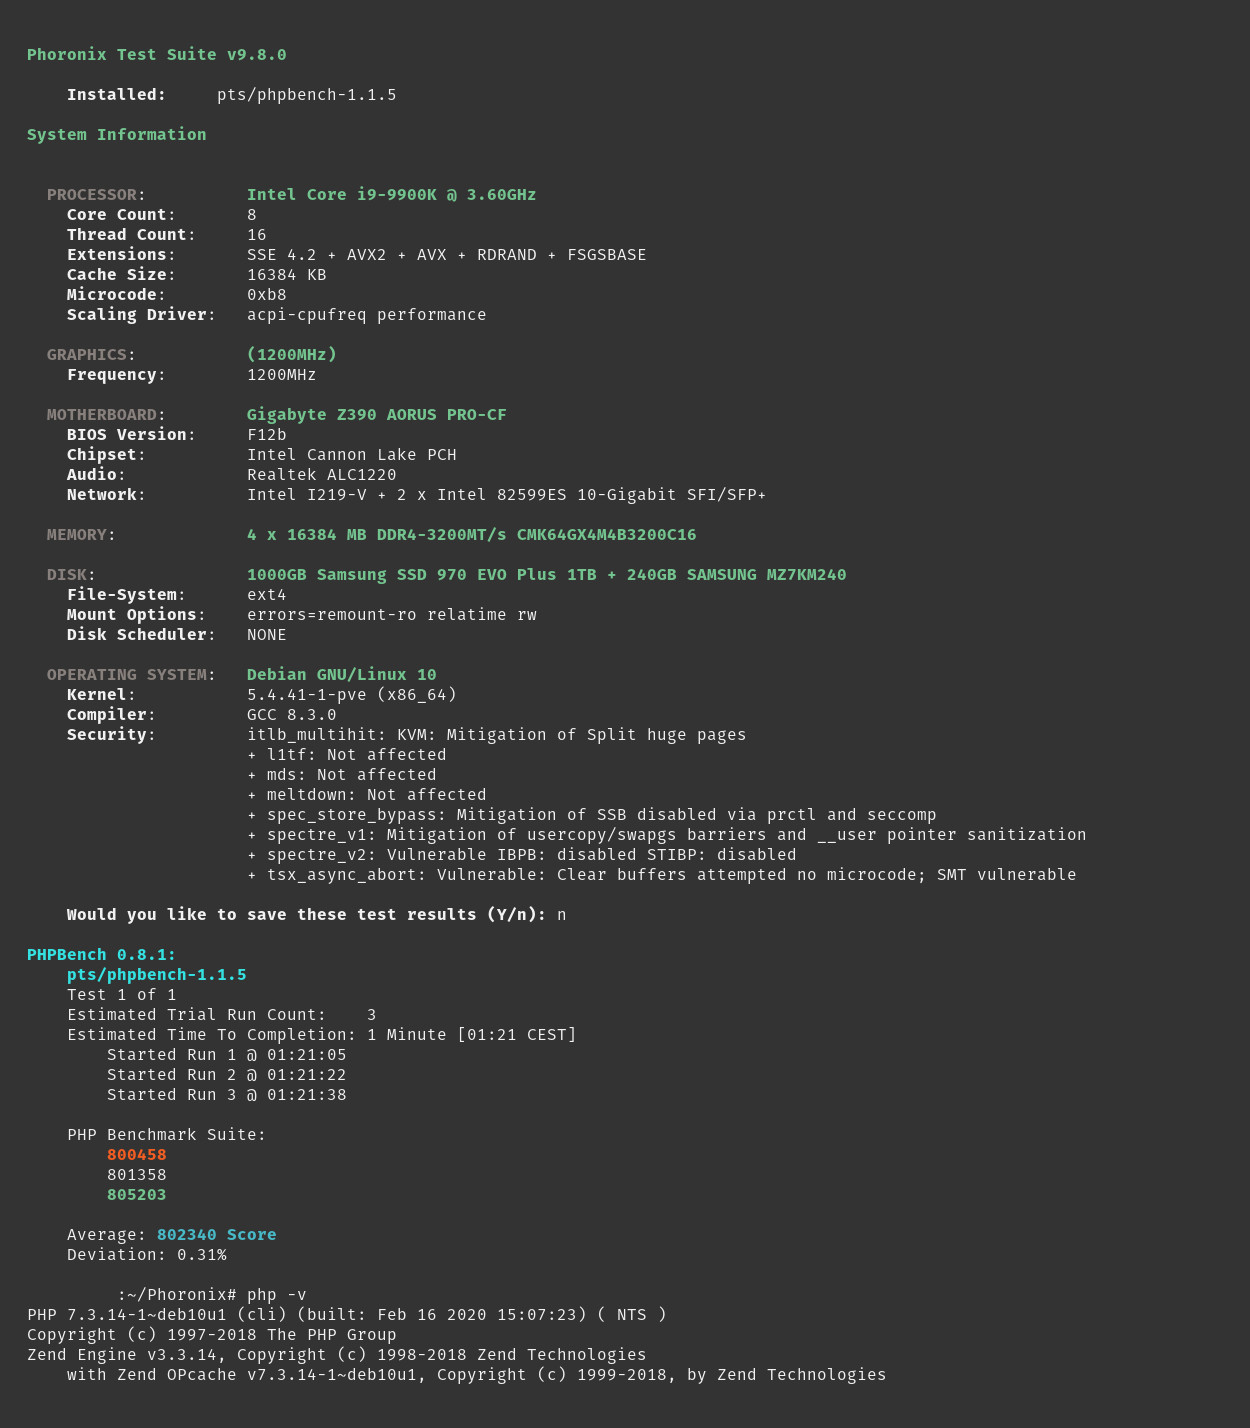
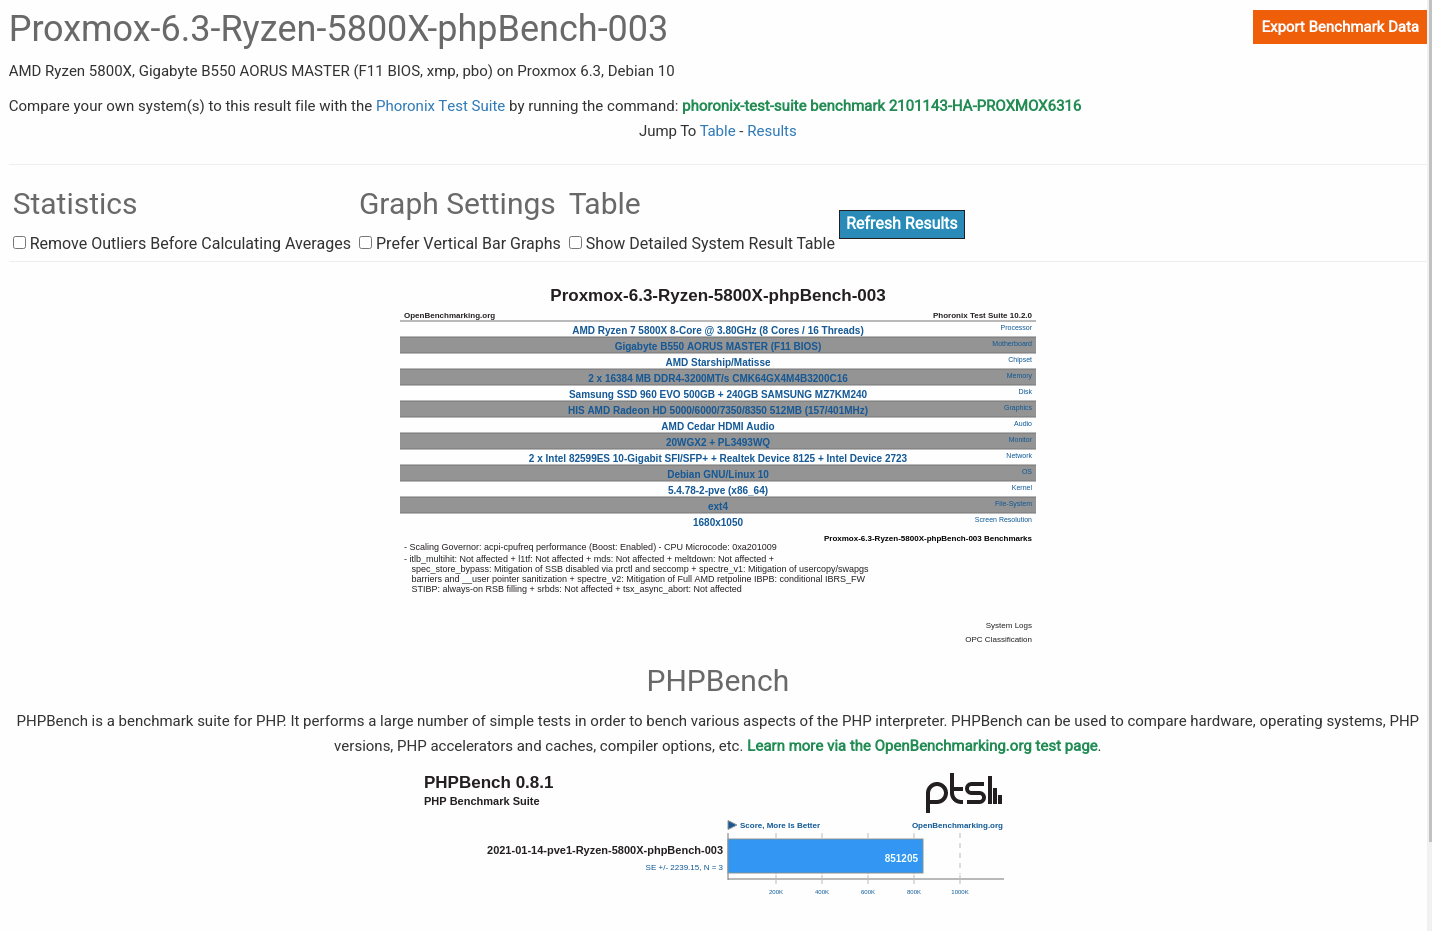
We wanted to test AMD ZEN 3 CPU to see if its performance in PHP is on par with various other benchmarks and reviews. We bought a Ryzen 5800X (8c/16t) and got a score of 851.205 (screenshot) in PHP bench by Phoronix test suite (Proxmox 6.3, Debian 10 Linux). At the moment of testing this score was the highest score of any CPU.
Ryzen 5800X (and probably 5900x & 5950X) is currently the fastest CPU for PHP workload.
If interested, read also the difference in PHP performance between bare metal and linux (LXC) container environment.
This post was partly inspired by "Why You Shouldn’t Use an Intel Xeon Silver Processor for SQL Server" (Glenn Berry; April 27. 2019) that showed how selecting a "wrong" CPU can have significantly lower performance even though on paper that part looks suitable.
Similar issue is happening in webhosting where utilized CPUs are often solid for multiple paralel http responses (webserver tasks for NGINX, Apache), but not so much for PHP processing of web frameworks like Wordpress & Magento. They seem fast when they serve fully cached content, but can easily require 1-3 sec when need to process requests in real time like admin pages, shopping carts, content for registered users etc. Put these frameworks/CMS on a shared hosting with a "bad" CPU and load times might get so long that some visitors and potential customers will just leave the page.

2 new PHP performance numbers
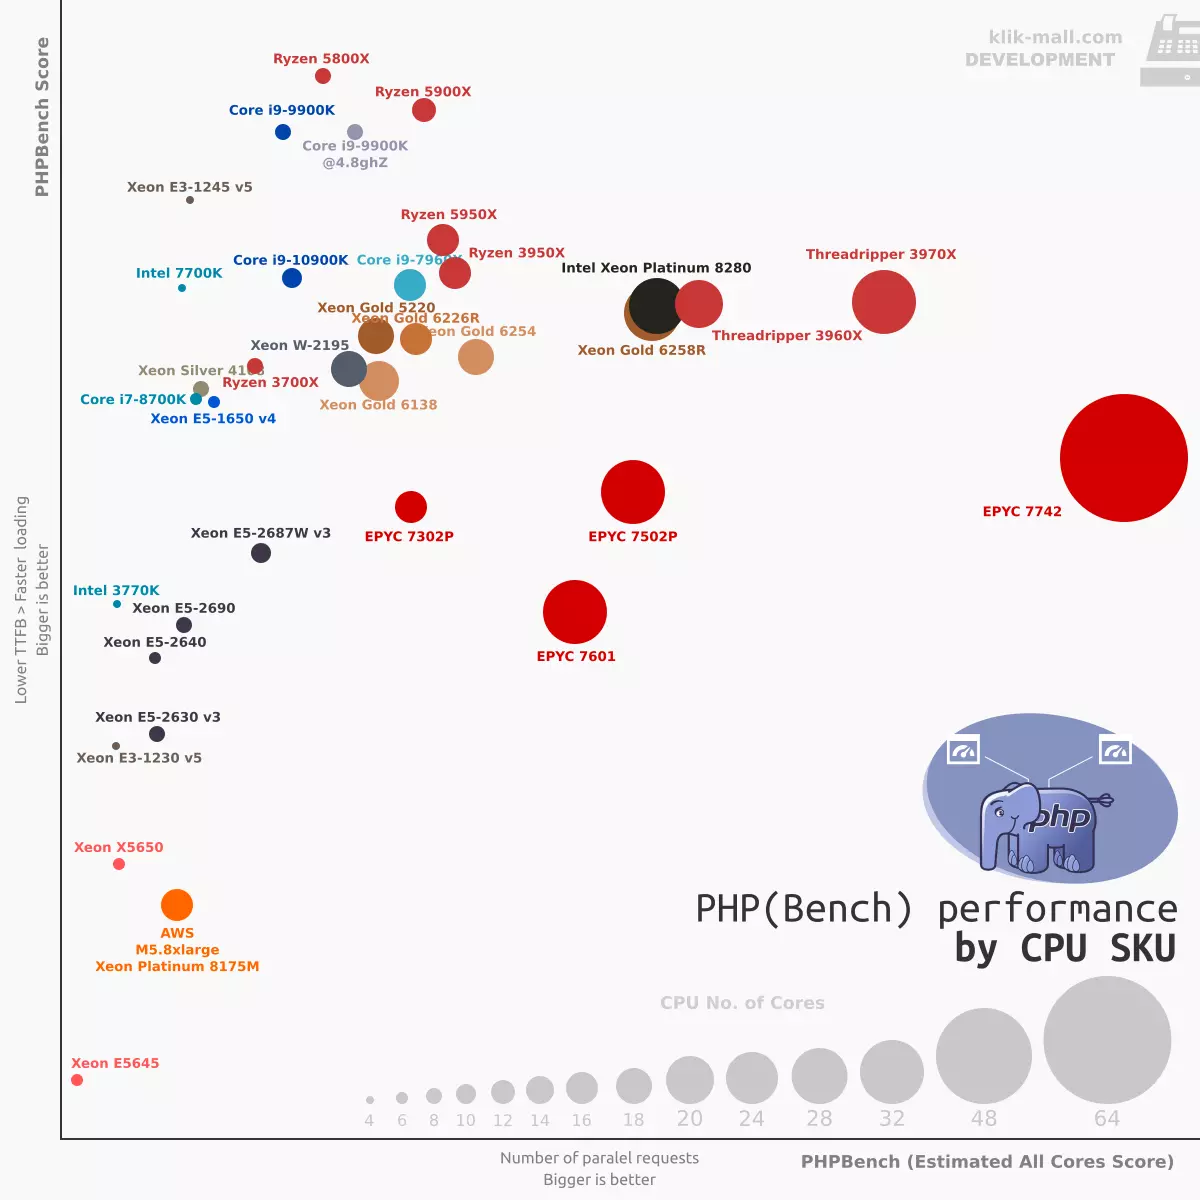
In our analysis of Impact of CPU speed on websites running PHP and a quest for the fastest CPU for PHP we've found 2 benchmarks (Phoronix PHPBench and Passmark CPU) to be quite useful in defining PHP processing speed by a specific CPU model. But we've also found a need to adjust these scores to better reflect real-case performance and usability.
- Real-case PHPBench (Single Core) performance - PHPBench gives us an estimate of PHP processing speed by a CPU SKU model. But one we get in real-life scenario can be much smaller than one gained in a synthetic benchmark on an idle computer due to CPU characteristics (esp. in environments like a shared webshosting).
- PHPBench (All Cores) score - We want the PHP code to be processed as fast as possible, but there are cases where a bit slower performance (results in longer Time To First Byte or. TTFB) combined with a capability of serving 3x as many paralel requests might be a better solution. That is why we also calulated an estimate of a "total PHP performance" which shows CPU capabilites in a case of serving large traffics.
How we caclulated estimates of "Real-life" and "All-Cores" PHP performance
- "PHPBench (Single Core) score" is an average result of a test from OpenBenchmarking PHPbench. It benchmarks single-threaded performance and reflects the best case scenario - processing PHP code on an idle computer which means running PHP test at single-core turbo frequency.
- But in "real-life" when a new request for PHP processing arrives a new process will be spawn on a core running at (opening) base frequency, not at turbo speed. Considering that a webserver will be busy (esp. a shared server) it will never reach turbo frequency that produced PHPBench score. As a PHP task should be processed in a very short time (1ms-10sec) it will very likely be processed from start to finish on a single core at speeds very close to base frequency. CPU does have its "all-core turbo" speeds, but those are often achieved on long-lasting uninterrupted tasks (e.g. video rendering).
- That is why we calculated adjusted single thread PHPBench score linked to CPU base freq. For this we used a formula:
Adjusted PHPBench Score = "PHPBench (Single Core) score" x ("BaseCpuFreq" / "TurboCpuFreq")
This number is a better estimate of available PHP processing speed when a new request arrives. - Up to this point we have the answers which SKUs will perform better for smaller traffics. But a 4c/8t CPU that runs @ 4.0GHz will very likely perform worse than a 24c/48t CPU @ 3.0GHz when serving 50 paralel requests. To get a sense of a full "PHP potential" of a CPU we multiplied previously calculated Adjusted PHPBench @ BaseFreq with Effective Core Count (~ 1.3 x Num.Of.Cores for hyper-threading capable processors). This shows us the score of a CPU serving "Eff. core count" paralel requests at its base frequency. The bigger the better.
How to read the results for PHP related tasks
Table below aims to help with providing:
- BASELINE CPU performance (Intel Xeon E5-2640 v1).
- "PHPBench (Single Core) score" is a max. capability of a CPU @turbo speed.
- Passmark (single core and multi core) results are added for additional comparison point as we've found single thread results to be quite well corelated with PHPBench scores.
- Estimate of "real life PHP performance".
- Estimate of an "All-Cores PHP performance".
- Relative PHPBench performances by a CPU in comparison to the BASELINE CPU. This shows how many % of performance does a specific CPU provide compared to BASE MODEL Xeon E5-2640. +78% means this CPU has 78% more performance than the base model.
How table reflects real-case usage
- To see which CPU is the fastest for a single PHP task in an ideal scenario check "PHPBench (Single Core) Score".
- To see which CPU will be the fastest on a shared server, check "Estimated real-case PHPBench (Single Core) score". It for example shows why workstation CPUs with higher base frequencies "feel faster" for PHP workload than commonly used "high-core-count, low-base-freq." models.
- If a server is having less paralel requests than there are available "effective cores" on a CPU (Cached http requests do not need PHP processing so they do not apply here), i9-9900K and its close relatives will process a given PHP code in the shortest time which will reflect in the shortest TTFB waiting times for the user.
- In case there are many more paralel requests that there are threads high core-count CPU like Intel Xeon W-2195, Intel Xeon Platinum 8860 or EPYC 7742 will provide better results that faster SKUs with small number of cores. For this check results under "Estimated real-case PHPBench (All Cores) Score". The added value of this calculation is a display that for example an Intel Xeon W-2195 might be having only 2% better adj. single core score than the base SKU, but a 305% (+205%) of total PHP performance due to a much bigger number of cores. It will also be helpful when you do not have a lot of traffic - getting a much cheaper CPU can save you money, power and still provide pretty much the same results.
- Action plan: To get the fastest response times (lowest TTFB, best UX) focus on "Estimated real-case PHPBench (Single Core) score". If you are having lots of traffic, focus should be on "Estimated real-case PHPBench (All Cores) score". If a single CPU can not get you a desired UX / TTFB or you just want "best of both worlds", you can set up a cluster of horizontally load-balanced smaller, but faster servers.

| CPU MODEL | HT | Num. of cores | Num. of threads | Base Freq. GHz | Turbo Freq. GHz | Passmark Single Core Perf. | Passmark Multi Core Perf. | PHPBench (Single Core) score | Relative to BASE model | Estimated real-case PHPBench (Single Core) score NEW | Relative to BASE model | Estimated real-case PHPBench (All Cores) score NEW | Relative to BASE model |
| Xeon X5650 | 6 | 12 | 2.7 | 3.1 | 1311 | 5.866 | 217.823 | -43% | 38.571 | -41% | 1.479.791 | -41% | |
| Xeon E3-1226 v3 |  |
4 | 4 | 3.3 | 3.6 | 2070 | 5.357 | - | - | - | - | ||
| Xeon E3-1230 v5 | 4 | 8 | 3.4 | 3.8 | 2238 | 7.368 | 314.100 | -18% | 281.037 | -12% | 1.461.392 | -41% | |
| Core i7-7700K | 4 | 8 | 4.2 | 4.5 | 2775 | 9.750 | 682.730 | +78% | 637.215 | +99% | 3.313.516 | +33% | |
| Xeon E3-1245 v5 | 4 | 8 | 3.4 | 4.1 | 2416 | 8.455 | 754.105 | +97% | 680.534 | +113% | 3.538.776 | +42% | |
| Xeon E5-2640 | 6 | 12 | 2.5 | 3.0 | 1348 | 6.289 | 383.494 | 0% | 319.578 | 0% | 2.492.711 | 0% | |
| Xeon E5-2690 | 8 | 16 | 2.9 | 3.8 | 1663 | 10.071 | 485.759 | +27% | 370.711 | +16% | 3.855.392 | +55% | |
| Xeon E5-4627 v2 | 8 | 8 | 3.3 | 3.6 | 1972 | 15.898 | 467.632 | +22% | 428.663 | +34% | 3.429.301 | +38% | |
| Xeon E5-2676 v3 aws.M4 | 12 | 24 | 2.4 | 3.0 | 1727 | 14.407 | - | - | - | - | - | - | |
| Xeon E5-2686 v4 aws.M4 | 18 | 36 | 2.3 | 3.0 | 1613 | 16.745 | - | - | - | - | - | - | |
| Xeon E5-2666 v3 aws.C4 | 9 | 18 | 2.9 | 3.3 | 1918 | 12.000* | - | - | - | - | - | - | |
| Xeon E5-2687W v3 | 10 | 20 | 3.1 | 3.5 | 1895 | 14.761 | 464.625 | +21% | 411.525 | +29% | 5.349.825 | +115% | |
| Xeon Silver 4108 | 8 | 16 | 1.8 | 3.0 | 1506 | 9.293 | 598.768 | +56% | 359.261 | +12% | 3.736.312 | +50% | |
| Intel Xeon E-2246G | 6 | 12 | 3.6 | 4.8 | 2895 | 14.237 | - | - | - | - | |||
| Intel Xeon E-2278G | 8 | 16 | 3.4 | 4.8 | 3041 | 17.386 | - | - | - | - | |||
| Intel Xeon E5-1650 v4 | 6 | 12 | 3.6 | 4.0 | 2330 | 11.300 | 589.786 | +54% | 530.807 | +66% | 4.140.298 | +66% | |
| Core i9-7960X | 16 | 32 | 2.8 | 4.2 | 2585 | 27.264 | 675.512 | +76% | 450.341 | +41% | 9.367.100 | +276% | |
| Intel Xeon W-2195 | 18 | 36 | 2.3 | 4.3 | 2360 | 23.487 | 606.573 | +58% | 324.446 | +2% | 7.592.037 | +205% | |
| Xeon Gold 5220 | 18 | 36 | 2.2 | 3.9 | 2396 | 25.740 | 632.875 | +65% | 357.006 | +12% | 8.353.950 | +235% | |
| Xeon Gold 6254 | 18 | 36 | 3.1 | 4.0 | 2381 | 29.356 | 615.954 | +61% | 477.364 | +49% | 11.170.326 | +348% | |
| Xeon Gold 6226R | 16 | 32 | 2.9 | 3.9 | 2173 | 26.842 | 632.601 | +65% | 458.636 | +44% | 9.539.623 | +283% | |
| Xeon Gold 6258R | 28 | 56 | 2.7 | 4.0 | 2011* | 37.575* | 643.737 | +68% | 434.522 | +36% | 15.816.618 | +535% | |
| Xeon Platinum 8175M | 24 | 48 | 2.7 | 3.5 | 1903 | 26.659 | - | - | - | - | - | - | |
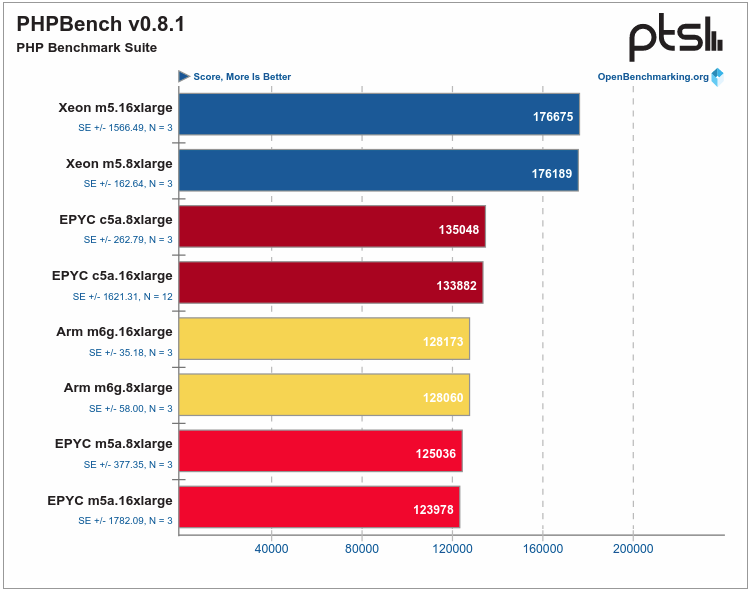
| Xeon Platinum 8175M aws.M5.8xlarge | 16 | 32 | 2.7 | 3.5 | - | - | 176.189 | -54% | 135.917 | -57% | 2.827.078 | +13% | |
| Xeon Platinum 8280 | 28 | 56 | 2.7 | 4.0 | 2011 | 37.575 | 637.497 | +69% | 438.186 | +37% | 15.949.959 | +540% | |
| i9-9700K | |
8 | 8 | 3.6 | 4.9 | 2917 | 14.618 | - | - | - | - | ||
| i9-9900K | 8 | 16 | 3.6 | 5.0 | 2981 | 18.877 | 805.554 | +110% | 579.999 | +81% | 6.031.988 | +142% | |
| i9-10900K | 10 | 20 | 3.7 | 5.3 | 3183 | 24.128 | 887.300 | +131% | 619.436 | +94% | 8.052.666 | +223% | |
| i5-11500 | 6 | 12 | 2.7 | 4.6 | 3154 | 17.614 | 965.346 | +152% | 566.616 | +77% | 4.419.606 | +77% | |
| Ryzen 3700X | 8 | 16 | 3.6 | 4.4 | 2687 | 22.781 | 616.984 | +61% | 504.805 | +58% | 5.249.973 | +111% | |
| Ryzen 5800X | 8 | 16 | 3.8 | 4.7 | 3511 | 28.682 | 851.205 | +122% | 688.043 | +115% | 7.155.643 | +187% | |
| Ryzen 3900X | 12 | 24 | 3.8 | 4.6 | 2730 | 32.848 | 643.165 | +68% | 531.310 | +66% | 8.288.439 | +233% | |
| Threadripper 3960X | 24 | 48 | 3.8 | 4.5 | 2698 | 55.517 | 654.177 | +71% | 552.416 | +73% | 17.235.383 | +591% | |
| Threadripper 3970X | 32 | 64 | 3.7 | 4.5 | 2706 | 55.517 | 648.911 | +69% | 533.549 | +67% | 22.195.640 | +790% | |
| EPYC 7402P | 24 | 48 | 2.8 | 3.4 | 1742 | 39.118 | 495.293 | +29% | 407.888 | +28% | 12.726.117 | +411% | |
| EPYC 7742 | 64 | 128 | 2.3 | 3.4 | 2376 | 67.185 | 498.121 | +30% | 336.964 | +5% | 28.035.422 | +1025% |
Other notes
- PHPBench scores are mostly taken from Phoronix OpenBenchmark PHP Bench results. Some have been obtained during our own testing on in-house hardware.
- Couple of results on OpenBenchmark page seem clearly wrong or were taken in some virtualized or unoptimal environment (PHP on Windows, old versions of PHP etc.) for example Intel Xeon E5-2680 v4 will not have a miserable score of 91.834 in a decent server setup. These results were excluded from this analysis.
- One result that stands out in a bit negative way but is still included is by the Intel i9-10900K. It has higher frequencies than i9-9900K and is pretty much the same CPU architecture. Its score should top this chart in PHPBench single thread performance.
- Pretty abysmal score by the AWS M5.8xlarge instance was published here: Benchmarks Of 2nd Gen AMD EPYC On Amazon EC2 Against Intel Xeon, Graviton2 by Michael Larabel (lead maintainer of Phoronix Openbenchmark.com, published on June 4th, 2020). So it seems highly unlikely that the benchmark was not done properly. Could be due to a virtualizated environment on Amazon Linux.
- Performance on bare-metal can difer quite a bit compared to any virtual environment (LXC containers, KVM, HyperV). We will have some posts on this topic, too.
- Selected CPUs reflect well known and/or common server CPUs over the last decade. There is a small bias towards high-frequency CPUs as we know from our experience that PHP prefers faster processors. We also focued more on models that we could get required PHPBench/Passmark data for (for those missing we plan to update this table when data is available as these CPUs seem "great on paper" for PHP).
- For consistency sake we try to use scores without Intel CPU mitigations (e.g Spectre and Meltdown) though we've noticed that mitigations turned on did have an impact on many benchmarks.
Q: So, should you pick a Xeon Silver 4108 for your PHP webserver?
Its PHPBench score (598.768) seems good, but its base frequency @ 1.8 GHz is alarmingly low for short-lasting, single-thread bounded tasks (like PHP). Looking only at PHPBench and turbo speed of 3.0GHz it seems like a mid-tier option. But when you consider it in a webhosting environment that will keep it close to 1.8GHz for an incoming PHP task that needs to be processed ASAP and where miliseconds determine UX, this CPU looks much worse. I'd argue that every small E3 or E-2xxx Xeon on this list would perform (far) better and probably for a much smaller cost.
Intel Xeon Silver SKU is not good for the database. It seems that it is a poor choice for PHP, too.
In general you will not go wrong by selecting a fast CPU (high frequencies) as this is often the first bottleneck you encounter. But in case of huge traffics it is good to know which CPUs provide bigger upside.
Links


